Your WhatsAppstatistics at a glance.
SmartChat shows you how many of your WhatsApp messages are read, how many new contacts come in and how many clicked on the last newsletter.

See how your list grows.
In the overview, your new signups appear as bars. If you choose "This year", SmartChat shows each month separately and compares the year with the previous year.
- 64Jan
- 71Feb
- 92Mar
- 118Apr
- 136May
- 124Jun
- 109Jul
- 97Aug
- 131Sep
- 102Oct
Five areas for all your numbers.
glance
Sent, read and clicked over time (more about link click tracking), plus total contacts, new signups and your best newsletters.
Start viewMessages
Sent and received, split by type of message.
By typeContacts
Signups of the last weeks as a calendar and where your new contacts come from.
CalendarFollow-ups & newsletters
Every send in a table with Sent, Delivered and Unsubscribes.
All comparedLanding page
Visits, signups and signup rate of your landing page, plus where the visits come from.
Signup rate
Every number analyzed in detail.
SmartChat compares every metric automatically. The figure next to the number shows you your performance right away.

Plus or minus in percent
Next to every metric, it shows by how many percent it rose or fell.
Today hour by hour
If you choose Today, SmartChat shows the current day up to the current time.
Your year against the previous year
That's how you see whether the months so far are going better than the same months last year.
Every send compared.
Under Follow-ups & Newsletter, every send appears in a table. One click opens the numbers of a single newsletter, so you compare your sends at a glance.

Separate or together
With the chips at the top you show all sends, only follow-ups or only newsletters.
Unsubscribes at a glance
If the value rises for a send, more contacts wrote STOP. The topic then fit them less.
Sort with one click
One click on a column sorts the table, for example by the most messages sent.
Which messages get read.
Under Messages, SmartChat splits everything you send by type. That way you see whether newsletters, follow-ups or automations perform better.

Everything that is sent
Newsletters, follow-ups, automations, confirmations and your replies in the chat, each type on its own.
What you receive, too
How many messages your contacts send you appears right next to your own.
Delivered and read
For each type, you see in percent how many messages arrived and how many were read.
What your contacts ask about.
SmartChat assigns every message from your contacts to a topic and counts how often SmartChat AI replied. That way you know which questions most often land in the inbox.
96 messages, 81% of them answered by SmartChat AI.
74 messages, 64% of them answered by SmartChat AI.
61 messages, 97% of them answered by SmartChat AI.
38 messages, 89% of them answered by SmartChat AI.





Where your new contacts come from.
Under Contacts, SmartChat shows which way someone signed up and how many of them confirmed in WhatsApp.

Landing page or popup
You see whether more prospects sign up through your landing page or the website popup.
Confirmed in percent
Only those who confirm in WhatsApp get your newsletters. The value shows how many took this step.
As a calendar
Every day is a box. That way you see on which weekdays most people sign up.
How well your landing page works.
Under Landing page, you find visits, signups and the signup rate. Here you see whether more visits also bring you more signups.

Visits and signups over time
Both values are in the same chart, day by day or week by week.
Signup rate as a gauge
The needle shows you at a glance how many visitors also sign up.
Compared here too
SmartChat also compares visits, signups and signup rate with the previous period.
Where your visitors come from.
SmartChat recognizes whether someone reaches your landing page via Instagram, Google, WhatsApp or directly. That way you know where your link pays off most.
- 684Instagram
- 521Google
- 388Direct
- 214WhatsApp
- 125Facebook
Your numbers where you need them.
You don't have to click into the statistics every time. Ask SmartChat AI, download a report or pull the numbers into your own program.
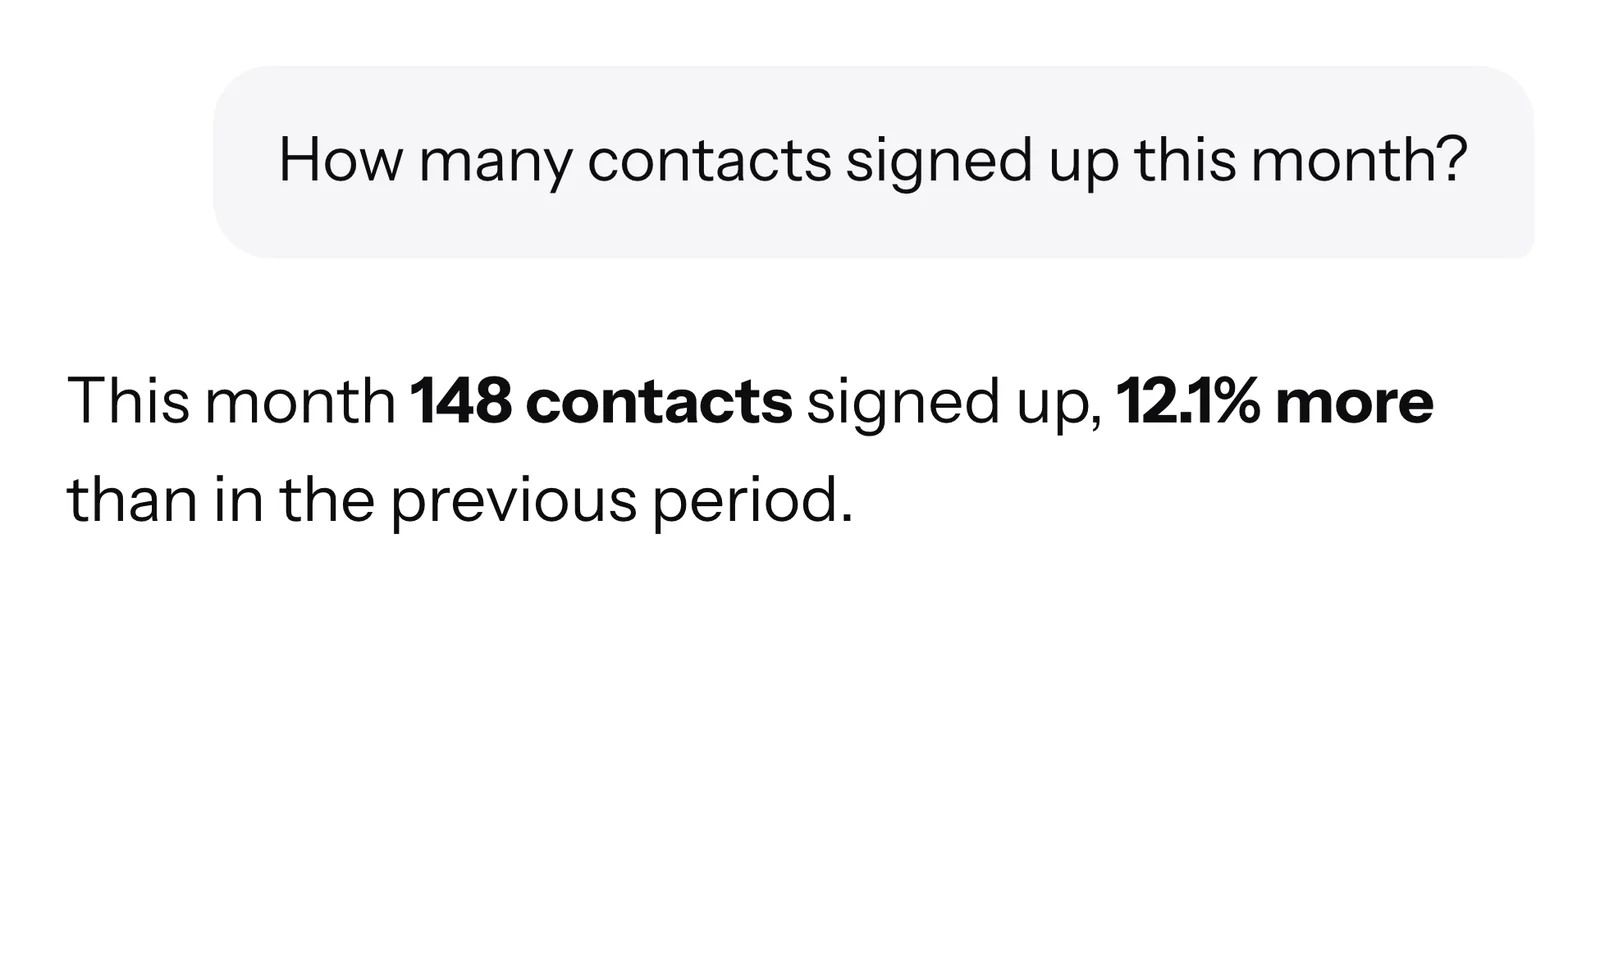
You ask SmartChat AI
Write in the AI Chatwhat you want to know. SmartChat AI answers with the number and a comparison. You don't have to search for a section or period.
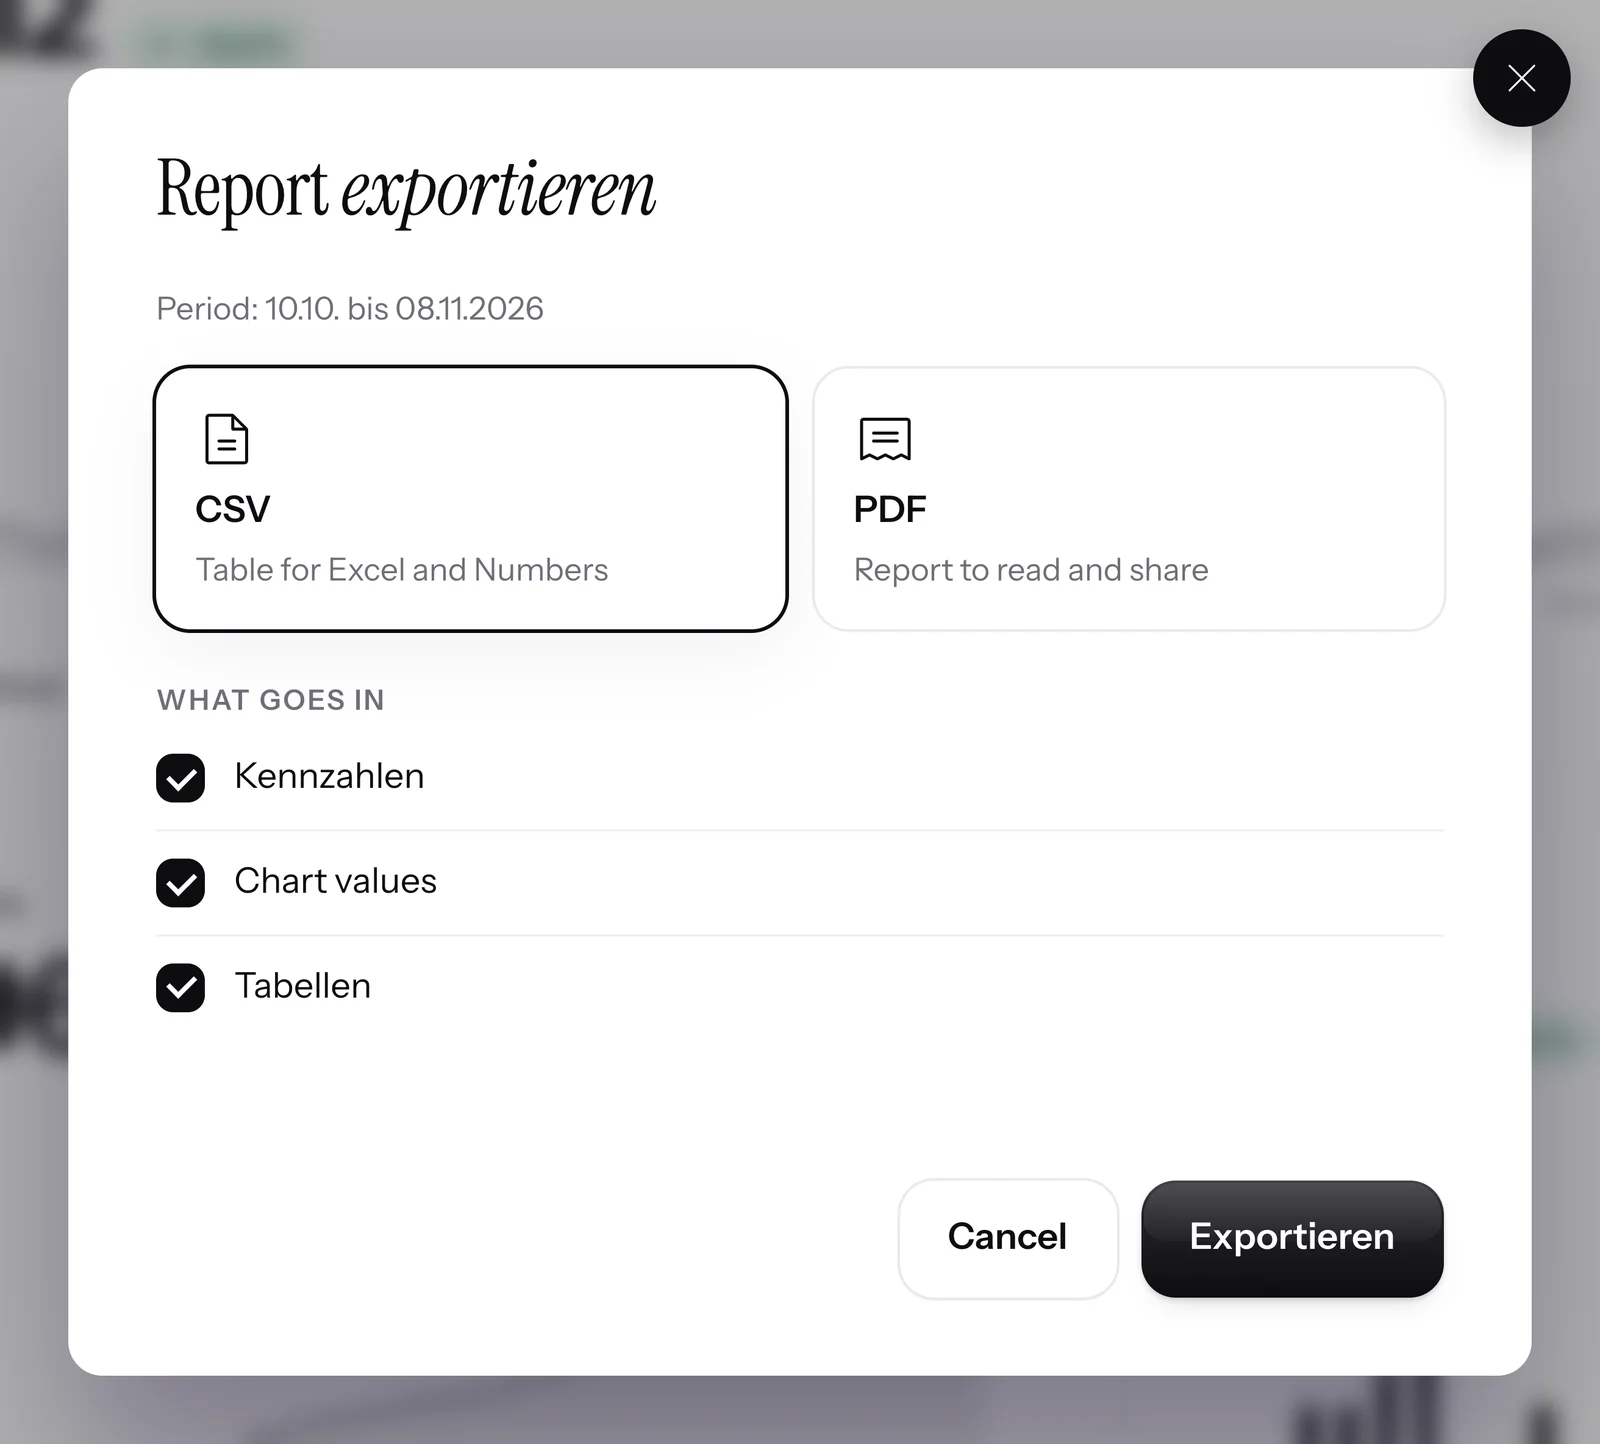
You download the report
With Export report, you download the numbers of your period as a CSV file and open it in Excel or Numbers. There is no PDF report yet.
GET /v1/stats Recht: stats:read { "kpis": { "sent": 4812, "delivered": 4731, "contacts_total": 1396, "contacts_new": 148 } }Your program fetches the numbers
Via the API, your system retrieves the statistics, with a key so that only your system may read them.

Guessing vs. Knowledge.
Without numbers, every action stays a gut feeling. With the statistics, you see what lands with your contacts.
Without statistics
- You don't know whether your newsletter was even read
- Whether your new promotion brings signups stays a feeling
- Which questions come up most often, you only notice after weeks
- For every report, you gather numbers from several programs
With SmartChat
- Sent, delivered and read for every newsletter and every follow-up
- New signups per day, week or month, compared with the previous period
- The most common topics in the inbox and how many of them SmartChat AI answers
- All numbers in one place, as CSV or via the API
Statistics in every plan.
The statistics are included in all plans. The only differences are price and number of messages. All prices plus VAT.
| Free | Starter | Basic | Pro | |
|---|---|---|---|---|
| Price per month | 0 € | 299 € | 499 € | 999 € |
| Messages | 100 one-time | 3,000 per month | 6,000 per month | unlimited |
| All five areas | yes | yes | yes | yes |
| Comparison with the previous period | yes | yes | yes | yes |
| Report as CSV | yes | yes | yes | yes |
| Statistics via the API | yes | yes | yes | yes |
Frequently asked questions about Statistics.
Which numbers does SmartChat show in the statistics?
SmartChat divides your numbers into five areas: Overview, Messages, Contacts, Follow-ups & Newsletter and Landing page. There you'll find, among other things, Sent, Delivered and Read, new signups, total contacts and the visits to your landing page.
Can I see the numbers for a single newsletter?
Yes. Under Statistics, in the Follow-ups & Newsletter area, you click on the send and see Sent, Delivered and Unsubscribes. Under Newsletter in the Sent tab, you also see Recipients and Read. You'll find examples to compare with under WhatsApp marketing for marketing agencies and WhatsApp marketing for retailers.
How do I compare two periods?
SmartChat does that automatically. Every metric is compared with the period of the same length before it, with yesterday for Today and with the previous year for This year.
How long can a custom period be?
In the calendar, you choose start and end freely. Depending on the length, SmartChat shows the values hour by hour, day by day, per week or per month.
Can I download the statistics as a file?
Yes, with Export report you get a CSV file for Excel or Numbers. You choose whether metrics, chart values or tables are included. There is no PDF report yet.
How does SmartChat know how a contact signed up?
SmartChat saves the source for every contact, for example landing page, website popup or import. Anyone who wrote to you first is listed under Wrote first.
What does "What customers ask about" show?
SmartChat sorts your contacts' messages into topics, for example opening hours, prices and costs, or booking and reservation. For every topic, you see the number of messages and how many of them SmartChat AI answered. How a brewery works with this is shown in WhatsApp marketing for breweries.
Can I ask SmartChat AI about my numbers?
Yes, just write your question in the AI Chat, for example how many contacts signed up this month. SmartChat AI answers with the number and the trend.
Are the statistics available in every plan?
Yes, the statistics are available in every plan, even in the free Free plan. SmartChat costs from 299 € per month, Free costs 0 € and runs with no time limit. All prices plus VAT.
Do the statistics cost credits?
No, viewing and exporting cost no credits. If you ask SmartChat AI in the AI Chat about your numbers, that message uses credits like any other message in the AI Chat.
Are there additional costs from Meta for WhatsApp?
Meta charges the fees for WhatsApp messages directly to you. For this, you add a payment method in your Meta account. Sending costs no credits in SmartChat. With SmartChat, you also pay for your plan. More on this under Meta fees.
What counts as an unsubscribe in the statistics?
An unsubscribe counts when a contact writes STOP in the chat. After that, SmartChat sends them no more newsletters and shows them as unsubscribed in your contact list.
Can I retrieve the statistics via the API?
Yes, your program fetches the metrics via the API. For that, the API key needs the permission to read statistics.
Your numbers at a glance.
Enter your website. In 60 seconds, your WhatsApp marketing system is ready, and the statistics count along from your first message.